Earlier, 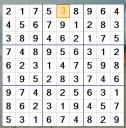 which is, almost a year ago, I was comparing owner-draw programming in Delphi and C# and concluded that it’s quite similar: basically you set any visual component in a particular mode (‘I’m going to take care of drawing the content’) and then you basically override the component’s OnPaint/OnDraw event. Drawing the actual stuff is the hardest part, but there’s pretty good API help for both Win32 and .Net platforms. If you have programmed graphics in Win32 before, this is going to be a piece of pie.
So, yeah: a couple of years ago, I did some fancy stuff in a Delphi Drawgrid component. The .Net framework has a similar ‘grid’ like component, which is called a ‘Datagridview’ and you probably guessed it: it has basically the same functionality and offers the (almost) the same features as Delphi’s DrawGrid component. This brings me to that earlier mentioned project I was working on: a Sudoku puzzle generator, which obviously needed to use a custom grid-like component with a lot of colours (Warning: if you’re not interested in programming, you probably don’t want to continue reading).
Before you go copy and paste the code into your project: the moment that you start overriding the dataGridView’s CellPaint event, you are in charge of drawing everything that has to do with the grid’s cells. This means that you should be aware of the fact that each cell can have different states: for example, cells can be selected, frozen, read-only or a mix of all these states at the same time (Look for the DataGridViewElementStates Enumeration). You are going to have to test each cell’s state for each particular state that you planned to take care of. In the sample below, I’m only testing for the Selected and Displayed state: When a user selects a cell, the border will get a nice thick orange border. In other cases, cells should be drawn as much as Sudoku puzzles look like in your daily paper: that is, after every 3 columns and rows, there’s going to be a nice thick line that separates each 3×3 grid from the one next to it.
        private void dataGridView1_CellPainting(object sender,
               DataGridViewCellPaintingEventArgs e)
        {
            using (Brush backColorBrush =
                       new SolidBrush(e.CellStyle.BackColor),
                  gridBrush =
                       new SolidBrush(this.dataGridView1.GridColor))
            {

                using (Pen gridLinePen = new Pen(gridBrush))
                {


                    int x = e.ColumnIndex + 1;
                    int y = e.RowIndex + 1;


                    // 1. Draw the background first.
                    e.Graphics.FillRectangle(backColorBrush, e.CellBounds);

                    // 2. Test if the cell is selected
                    if ((e.State & DataGridViewElementStates.Selected)
                         == DataGridViewElementStates.Selected)
                    {

                        // Draw Orange stuff...
                        gridLinePen.Width = 3;
                        gridLinePen.Color = Color.Orange;
                        e.Graphics.FillRectangle(Brushes.NavajoWhite,
                             e.CellBounds);

                        e.Graphics.DrawRectangle(gridLinePen,
                            e.CellBounds.Left + 1,
                            e.CellBounds.Top + 1,
                            e.CellBounds.Width - 4,
                            e.CellBounds.Height - 4);

                        if (((x % 3) == 0) && (x != 0))
                        {
                            gridLinePen.Width = 3;
                            gridLinePen.Color = Color.Navy;
                            e.Graphics.DrawLine(gridLinePen,
                               e.CellBounds.Right - 1, e.CellBounds.Top,
                                e.CellBounds.Right - 1, e.CellBounds.Bottom);

                        }
                        else
                        {
                            gridLinePen.Width = 1;
                            gridLinePen.Color = this.dataGridView1.GridColor;
                            e.Graphics.DrawLine(gridLinePen,
                                e.CellBounds.Right - 1, e.CellBounds.Top,
                                e.CellBounds.Right - 1, e.CellBounds.Bottom);
                        }

                        if (((y % 3) == 0) && (y != 0))
                        {
                            gridLinePen.Width = 3;
                            gridLinePen.Color = Color.Navy;
                            e.Graphics.DrawLine(gridLinePen,
                                e.CellBounds.Left, e.CellBounds.Bottom - 1,
                                e.CellBounds.Right - 1,
                                e.CellBounds.Bottom - 1);
                        }
                        else
                        {
                            gridLinePen.Width = 1;
                            gridLinePen.Color = this.dataGridView1.GridColor;
                            e.Graphics.DrawLine(gridLinePen,
                                e.CellBounds.Left, e.CellBounds.Bottom - 1,
                                e.CellBounds.Right - 1,
                                e.CellBounds.Bottom - 1);
                        }

                        // Draw the actual data....
                        if (e.Value != null)
                        {

                            StringFormat np = new StringFormat(StringFormat.GenericDefault);
                            np.Alignment = StringAlignment.Center;
                            np.LineAlignment = StringAlignment.Center;

                            e.Graphics.DrawString(e.Value.ToString(), e.CellStyle.Font,
                                Brushes.Orange, e.CellBounds, np);
                        }

                    }

                    // 3. Draw normal cells...
                    if ((e.State &  DataGridViewElementStates.Displayed)
                        == DataGridViewElementStates.Displayed)
                    {

                        if ((x % 3) == 0 && (x != 9))
                        {
                            gridLinePen.Width = 3;
                            gridLinePen.Color = Color.Navy;
                            e.Graphics.DrawLine(gridLinePen,
                               e.CellBounds.Right - 1, e.CellBounds.Top,
                                e.CellBounds.Right - 1, e.CellBounds.Bottom);

                        }
                        else
                        {
                            gridLinePen.Width = 1;
                            gridLinePen.Color = this.dataGridView1.GridColor;
                            e.Graphics.DrawLine(gridLinePen,
                                e.CellBounds.Right - 1, e.CellBounds.Top,
                                e.CellBounds.Right - 1, e.CellBounds.Bottom);
                        }

                        if (((y % 3) == 0) && (y != 9))
                        {
                            gridLinePen.Width = 3;
                            gridLinePen.Color = Color.Navy;
                            e.Graphics.DrawLine(gridLinePen,
                                e.CellBounds.Left, e.CellBounds.Bottom - 1,
                                e.CellBounds.Right - 1,
                                e.CellBounds.Bottom - 1);
                        }
                        else
                        {
                            gridLinePen.Width = 1;
                            gridLinePen.Color = this.dataGridView1.GridColor;
                            e.Graphics.DrawLine(gridLinePen,
                                e.CellBounds.Left, e.CellBounds.Bottom - 1,
                                e.CellBounds.Right - 1,
                                e.CellBounds.Bottom - 1);
                        }


                        // Draw the actual data.
                        if (((e.State & DataGridViewElementStates.Selected)
                            == DataGridViewElementStates.Selected) == false)
                        {
                           e.PaintContent(e.ClipBounds);
                        }

                    }
                }
            }
            e.Handled = true;
        }
Note that .Net supports specific portions of a cell to be drawn automatically (or rather by the system itself), which will save you some headaches: for example normal cells (the ones that have the Cellstate of ‘displayed’) I use the e.PaintContent method to force the component to paint the content.